

Why “ranking #1” doesn’t mean what you think — how to measure where your listing actually appears on the screen, with a full pixel breakdown of the Philippine SERP for “free seo training philippines.”
The report says you won. The traffic says you didn’t.
Every SEO has seen this one. Rankings are stable. Position #1 for the money keyword, position #3 for two more. And clicks are down 30% quarter over quarter.
The instinct is to blame an algorithm update. Usually the answer is simpler and more physical: your listing never moved, but the page around it got taller. Position #1 in 2019 sat roughly 300 pixels from the top of the screen. Today the median #1 result on desktop sits around 1,000 pixels down. The rank didn’t change. The distance did.
That gap — between where you rank and how far down you actually are — is what pixel rank tracking measures.
What pixel rank tracking actually is
Pixel rank tracking measures how far down the results page, in pixels, your listing appears — instead of which numbered slot it occupies.
Ordinal rank quietly assumes every result above you takes up the same amount of space. That assumption held when a SERP was ten blue links of near-identical height. It does not hold now. Today’s results page is a stack of variable-height blocks: AI Overviews, expanded ad units, People Also Ask, video carousels, Places packs, forum results with nested answers. Each renders at a different height, and that height changes by query, by device, and sometimes by hour.
Rank tells you your place in a queue. Pixel depth tells you whether anyone in that queue can see you.
The numbers that make this urgent
Large-scale studies of the 2026 search landscape put hard figures on the squeeze:
- The desktop fold sits at roughly 800 pixels; the mobile fold at roughly 400 pixels.
- The median desktop position #1 now sits about 1,000 pixels down — meaning more than half of all #1 rankings are already below the fold.
- Position #2 typically sits another 250–300 pixels below position #1.
- A desktop AI Overview averages about 1,110 pixels when expanded (617 px on mobile). One AI Overview can consume more than a full mobile screen on its own.
- Only about 10% of searches now show even one complete organic result above the fold.
- Four or more organic results above the fold happens less than 1% of the time.
One finding deserves a pause: the biggest recent downward shove came less from AI Overviews than from paid units getting physically larger. Ads didn’t multiply — they got taller. Which is exactly the kind of change ordinal rank tracking cannot see.
How to calculate pixel rank
The concept is simple: measure the vertical distance, in CSS pixels, from the top of the results page to the top of your listing’s container. There are three ways to get there.
1. The tooling route
seoClarity, AccuRanker, Advanced Web Ranking, Similarweb, DemandSphere and Myposeo all report pixel position; Ubersuggest has a lighter version. They render the SERP at a fixed viewport and measure the bounding box of each result. Fastest option, and the right one at scale.
2. The DIY route
Load the SERP in a headless browser at a fixed viewport and read the offset directly:
document.querySelector('#search a[href*="yourdomain.com"]')
        .closest('div.g')
        .getBoundingClientRect().top + window.scrollY
3. The screenshot route (no tools required)
You can measure pixel depth from screenshots alone — which is exactly how the case study below was produced.
- Take your screenshots. Capture the SERP from the top, then scroll and capture again with some overlap. Note that Retina Mac captures are typically 2× the logical resolution, so raw image pixels are not CSS pixels.
- Find your scale factor. Use an element of known height. The People Also Ask block is ideal — each question row is 54 CSS pixels tall. Measure the spacing between two PAA questions in your image and divide by 54. In the case study below, PAA rows were 72 image pixels apart: 72 ÷ 54 = 1.333.
- Convert. CSS pixels = image pixels ÷ scale factor. At 1.333×, that means multiplying every image measurement by 0.75.
- Chain your scrolls. For a page taller than one screen, find an element visible in two consecutive screenshots and use it to stitch them into one continuous coordinate system.
- Locate your fold. Subtract browser chrome and, on Mac, the menu bar from your screen height. A 14-inch MacBook Pro at 1512×982 with a maximized Chrome window gives roughly an 860-pixel fold.
It takes about ten minutes. Do it manually at least once — seeing your own SERP measured changes how you read every ranking report afterwards.
The four metrics worth tracking
First Brand Pixel (FBP). The depth at which your brand first appears anywhere on the page — organic, AI Overview citation, Places, PAA, or a social profile. This is your single most important visibility number, and it is usually far better than your organic depth.
Owned-domain pixel depth. Where your actual website appears. Keep this separate from FBP: a brand mention in an AI Overview builds awareness, but a link on your own domain earns the session.
Brand share of first screen. What percentage of the first viewport your brand occupies. This catches multi-asset visibility that rank tracking flattens into a single number.
Competitor-free depth. How far down the page a user can read before hitting a rival. This is the metric that tells you whether you own a SERP or merely appear on it.
Real example: “free seo training philippines”
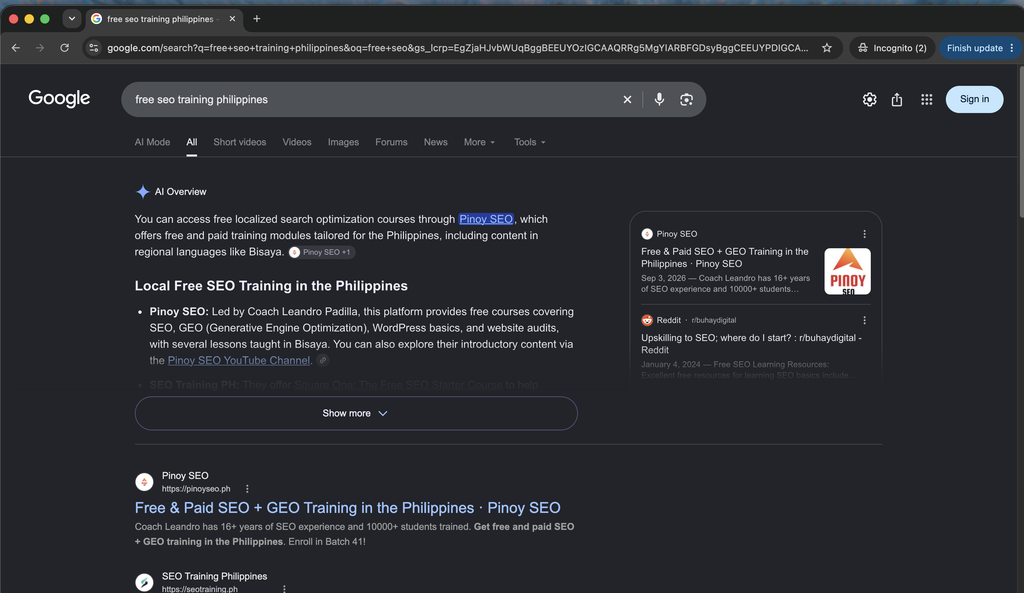

Here is a live measurement of a Philippine commercial SERP — Google, desktop, incognito, Philippines location, September 2026, measured with the screenshot method above. The fold sits at approximately 860 pixels.
Every Pinoy SEO appearance on page one
| # | Brand asset | Pixel depth | Above fold? |
|---|---|---|---|
| 1 | AI Overview — “Pinoy SEO” link in the opening sentence | ~224 | Yes |
| 2 | AI Overview right-rail source card (with brand logo) | ~217–290 | Yes |
| 3 | AI Overview source chip — “Pinoy SEO +1” | ~272 | Yes |
| 4 | AI Overview bullet #1 — “Led by Coach Leandro Padilla…” | ~360 | Yes |
| 5 | “Pinoy SEO YouTube Channel” link inside the AI Overview | ~431 | Yes |
| 6 | pinoyseo.ph homepage — organic #1 | ~590 | Yes |
| 7 | Facebook · Pinoy SEO (22.8K followers) | ~890 | Just below |
| 8 | LinkedIn · Pinoy SEO (330 followers) | ~1,331 | No |
| 9 | YouTube · Pinoy SEO (1.4K followers) | ~1,483 | No |
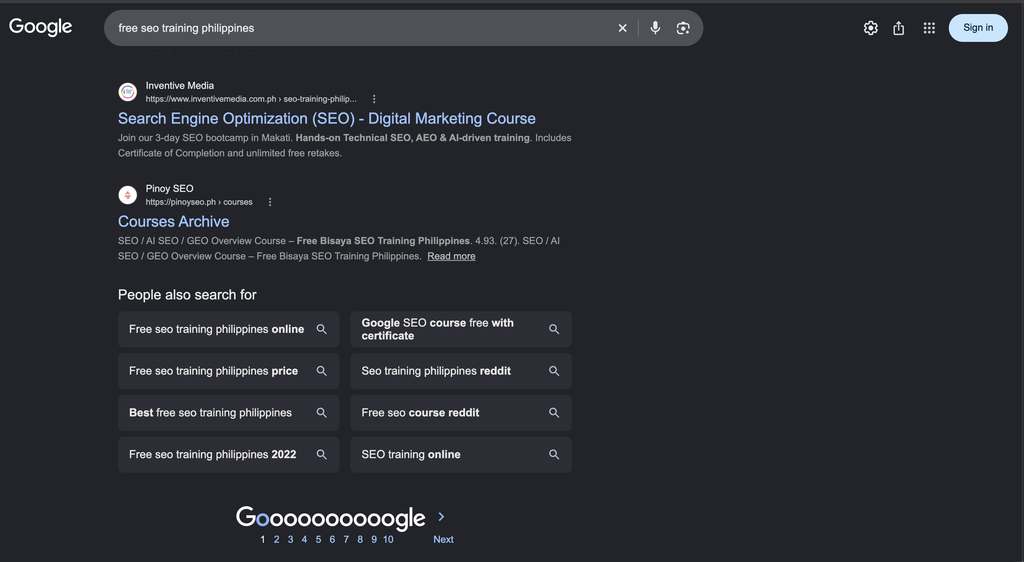
| 10 | pinoyseo.ph/courses — “Courses Archive” | ~2,192 | No |
Measurements below ~1,300 px are chained across screenshot boundaries; treat those as ±80 px.
Competitor and SERP-feature overlay

| Competitor / SERP feature | Pixel depth |
|---|---|
| seotraining.ph homepage — organic #2 | ~735 |
| People Also Ask block | ~1,040 |
| seotraining.ph — “Square One: The Free SEO Starter Course” | ~1,635 |
| Reddit — r/buhaydigital thread | ~1,785 |
| Inventive Media — SEO bootcamp Makati | ~2,042 |
| People Also Search For | ~2,360 |
Pixel depths measured on the same capture, same viewport.
What the numbers say
Pinoy SEO owns this SERP — it doesn’t just rank on it. The brand is the grammatical subject of the AI Overview’s opening sentence at 224 pixels, holds the image-bearing right-rail source card, is bullet #1 in the summary, and the homepage sits at organic #1, fully above the fold at 590 pixels. A user can read the entire first screen and encounter no competitor at all. seotraining.ph doesn’t appear until 735 pixels; Inventive Media doesn’t appear until 2,042 pixels — more than two full screens down.
Ten brand assets on one page. Website homepage, courses page, Facebook, LinkedIn, YouTube, plus five distinct AI Overview surfaces. Ordinal rank tracking reports this SERP as “#1.” That single number describes roughly 6% of what is actually happening on the page.
The differentiator Google chose. The AI Overview specifically cites “regional languages like Bisaya.” No competitor can replicate that quickly, and Google’s synthesis selected it as the defining attribute of the brand — a useful signal about which part of your positioning the model finds genuinely distinctive.
The same brand, a different keyword
Now the identical brand measured on “seo training philippines” — same day, same device, same setup:
| Metric | “free seo training philippines” | “seo training philippines” |
|---|---|---|
| First Brand Pixel | ~224 px | ~426 px |
| Owned-domain depth | ~590 px (above fold) | ~1,292 px (below fold) |
| Organic position | #1 | #3 |
| Competitors above the site | 0 | 2 |
| Brand share of first screen | ~37% | ~0% (AI Overview only) |
Two keywords, one brand, one measurement session.
Same brand. Same authority. Same day. A 702-pixel difference in owned-domain depth, and the difference between owning the first screen and being invisible on it. On the broader keyword, the Pinoy SEO listing sits about 460 pixels below the fold behind two competitors. On the “free” variant it sits above the fold at #1.
No ordinal rank report would show you that, because “#3” and “#1” look like a two-position gap. In pixels it is the difference between a user seeing you immediately and a user never seeing you at all.
Where pixel data exposes weaknesses that rank hides
A strong asset with a badly presented result. The pinoyseo.ph/courses page sits at 2,192 pixels — the deepest brand asset on the page. It ranks on the strength of “Free Bisaya SEO Training Philippines,” the exact differentiator the AI Overview singled out, but it surfaces with the title “Courses Archive” and a snippet that repeats itself verbatim. The best differentiator has the worst-presented listing. The fix is a dedicated landing page and a written meta description, not a link-building campaign.
Missing sitelinks on the #1 result. The homepage result occupies about 145 pixels. A sitelinked result adds roughly 60–100 pixels of owned vertical space, pushing competitors further down and increasing first-screen share at zero content cost.
An unclaimed PAA block at 1,040 pixels. Four questions, including “Where can I learn SEO for free?” — a direct match to the brand’s positioning. Winning one would place a fifth brand impression at ~1,100 pixels and break up the competitor stretch between 735 and 1,635.
Concentration risk. Roughly 77% of the above-fold brand presence depends on staying cited in the AI Overview. That is outstanding performance and concentrated exposure at the same time. AI Overviews re-synthesize; a citation is not a ranking, and it does not persist by default.
How to act on pixel data
Stop optimizing rank; start optimizing distance. Moving #4 to #3 on a SERP where #1 already sits at 1,400 pixels changes nothing. Moving #3 to #2 where the fold cuts at #2 is worth real money. Pixel depth tells you which SERPs still have a fold worth competing for.
Change format, not just position. If you can’t move up, move sideways into a format that renders higher — an AI Overview citation, a PAA answer, an image or video pack, a Places listing, a sitelinked result. Each one pulls your brand above your organic position.
Recalibrate your CTR curves. Most CTR models are ordinal and are now badly wrong on feature-heavy SERPs. Segment keywords by pixel depth before forecasting traffic from a ranking projection.
Track mobile separately. At a 400-pixel fold, a single AI Overview can mean nothing organic is visible at all. Mobile is where the damage shows up first and worst.
Track both AI Overview states. A collapsed AI Overview and an expanded one produce very different pixel depths for everything beneath. Report both — your organic depth is effectively bimodal depending on user behaviour.
The limitations, honestly
Pixel depth is a proxy for visibility, not for attention — a user who scrolls past an AI Overview may still engage deeply with the result below it. It is volatile: SERP features fire inconsistently, so single-day snapshots are noisy and you need trend lines to say anything confident. Personalization, ad-auction variation and dynamic layout shifts mean two measurements of “the same” SERP can legitimately differ. And it says nothing at all about whether the traffic converts.
A pixel figure is also meaningless without its viewport. Always record device, screen resolution, browser and location alongside the number, or you are comparing measurements that were never comparable.
The takeaway
Ranking #1 is a claim about a queue. Pixel depth is a claim about a screen. Only one of those is where your customers actually live.
Two questions replace “what do I rank?”:
- At what pixel does my brand first appear?
- How much of the first screen do I own?
Answer those two and you will know the thing your ranking report has never been able to tell you.
Measurements taken September 2026 on Google, desktop, incognito, Philippines location, at an ~860-pixel fold. Pixel figures are estimates derived from calibrated screenshots and carry roughly ±5% error, rising to ±80 px for elements chained across screenshot boundaries.

Coach Leandro is an award-winning SEO specialist in the Philippines with over 16 years of professional experience as an SEO consultant. He has successfully managed clients from the US, Australia, UK, and Canada, delivering data-driven strategies that generate measurable results in search engine visibility and business growth.
In 2024, he was recognized as the “Outstanding Digital Freelancer of the Year” by the City Government of Iligan for his significant contributions to the freelancing and digital marketing industry.
He is the Founder and Owner of SOVA.ph, PinoySEO.ph, and MalachiSoft.com, where he continues to lead projects, mentor aspiring professionals, and provide SEO training programs tailored to the global market.
As a trusted SEO consultant and business owner in the Philippines, Coach Leandro is dedicated to helping businesses and individuals achieve long-term online success.
Beyond his professional achievements, Coach Leandro is also a passionate drone pilot, enjoying aerial photography and creative storytelling through drone videography.